The Pandas DataFrame is a versatile, two-dimensional, size-mutable, and potentially heterogeneous data structure that organizes data in a tabular format with labeled axes—rows and columns. It is a core component of the Pandas library and widely used for data manipulation and analysis in Python.
A DataFrame represents data in a spreadsheet-like format, where rows and columns align seamlessly. This structure makes it intuitive for handling and analyzing datasets of varying complexity and size. The three primary components of a Pandas DataFrame are:
- Data: The core content, which can include values of different types (e.g., numeric, categorical, string, or even complex objects).
- Rows: Represent observations or entries in the dataset, each uniquely identified by an index.
- Columns: Represent features, variables, or attributes, each labeled with a unique name for easy identification.
Pandas DataFrames are highly flexible and support various operations such as filtering, grouping, merging, reshaping, and applying functions, making them indispensable for data analysis and preprocessing tasks. Their capability to handle diverse data types, combined with powerful built-in methods, makes DataFrames a cornerstone of data science workflow.
Installing Pandas
Installing Pandas is straightforward if Python and PIP are already set up on your system.
You can install Pandas by running the following command in your terminal or command prompt:
|
bash |
If the installation fails, consider using a Python distribution that includes Pandas by default, such as Anaconda or Spyder. These distributions provide an all-in-one environment for data analysis and scientific computing.
Importing Pandas
After installing Pandas, you can import it into your Python application using the import keyword:
|
python |
Once imported, Pandas is ready for use. Here's an example demonstrating its functionality:
Example
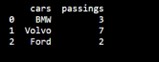
This code creates a Pandas DataFrame from a dictionary and prints its content.
Importing Pandas as pd
In Python, Pandas is typically imported using the alias pd for convenience and readability.
What is an Alias?
An alias is an alternative name that can be used to refer to the same object. When importing a library, you can assign an alias using the as keyword.
Creating an Alias for Pandas
Use the following syntax to import Pandas with the pd alias:
| import pandas as pd |
With this alias, you can refer to the Pandas library as pd instead of typing the full name.
Example
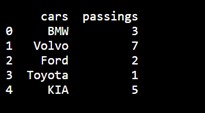
This example demonstrates creating and printing a Pandas DataFrame using the pd alias.
Pandas Series
What is a Series?
A Pandas Series is similar to a column in a table. It is a one-dimensional array capable of holding data of any type.
Example: Creating a Series
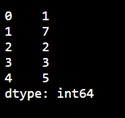
Here’s how to create a simple Pandas Series from a list:
|
import pandas as pd |
Output:
Labels
By default, the values in a Pandas Series are labeled using their index numbers. The first value has an index of 0, the second value has an index of 1, and so on. These labels can be used to access specific values.
Example: Accessing a Value by Index
| # Return the first value of the Series print(myvar[0]) |
Output:
| 1 |
Creating Custom Labels
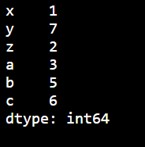
You can define your own labels for a Series using the index argument.
Example: Custom Labels
| import pandas as pd a = [1, 7, 2] # Create a Series with custom labels myvar = pd.Series(a, index=["x", "y", "z"]) print(myvar) |
Output:
Accessing Values Using Custom Labels
Once custom labels are defined, you can access values by referring to these labels.
Example: Accessing a Value by Label
|
import pandas as pd |
Output:
| 7 |
Creating a Pandas DataFrame
A Pandas DataFrame can be created by loading datasets from various storage sources, including SQL databases, CSV files, Excel files, and even JSON files. Additionally, DataFrames can be constructed directly from Python data structures such as lists, dictionaries, or even lists of dictionaries. This flexibility allows data to be easily imported from external sources or created programmatically within Python, enabling seamless data manipulation and analysis. The DataFrame is a powerful data structure in Pandas, ideal for handling and transforming data for a wide range of applications, from simple analyses to complex data processing workflows.
Here are some ways by which we create a dataframe:
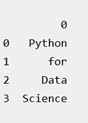
Creating a dataframe using List: DataFrame can be created using a single list or a list of lists.
| import pandas as pd # list of strings list = ['Python', 'for', 'Data', 'Science'] # Calling DataFrame constructor on list df = pd.DataFrame(list) print(df) |
Output:
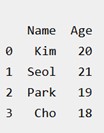
Creating DataFrame from dict of ndarray/lists: To create DataFrame from dict of narray/list, all the narray must be of same length. If index is passed then the length index should be equal to the length of arrays. If no index is passed, then by default, index will be range(n) where n is the array length.
| # Python code demonstrate creating # DataFrame from dict narray / lists # By default addresses. import pandas as pd # initialize data of lists. data = {'Name':['Kim', 'Seol', 'Park', 'Cho'], 'Age':[20, 21, 19, 18]} # Create DataFrame df = pd.DataFrame(data) # Print the output. print(df) |
Output:
Rows and Columns in Pandas DataFrame
A DataFrame is a two-dimensional data structure in Pandas, meaning that data is organized in rows and columns, like a table. This structure allows for efficient data manipulation and analysis. In Pandas, we can perform a variety of operations on rows and columns, including selecting, deleting, adding, and renaming.
- Selecting: Rows or columns can be selected using index labels or column names. For example, you can use df['column_name'] to select a column or df.iloc[] for row-based indexing.
- Deleting: Rows or columns can be deleted using the drop() method. You can remove specific rows or columns by specifying their index or column name, and you can choose to modify the DataFrame in place or return a new one.
- Adding: New rows or columns can be added to the DataFrame by directly assigning values. For example, df['new_column'] = values will add a new column, while df.loc[index] = row_values can be used to append a new row.
- Renaming: Columns and rows can be renamed using the rename() method, where you provide a dictionary mapping old names to new ones.
Column Selection:
To select a column in a Pandas DataFrame, we can access it by its column name. This is done by using the column name within square brackets, like df['column_name']. This allows you to extract the column as a Pandas Series, making it easy to perform further operations on it. You can also select multiple columns by passing a list of column names, such as df[['col1', 'col2']].
Row Selection:
Pandas provides several methods to retrieve rows from a DataFrame.
- The loc[] method is used for label-based row selection. It allows you to select rows by their index labels, such as df.loc[2] to retrieve the row with index 2, or df.loc[2:5] to select a range of rows from index 2 to 5.
- The iloc[] method, on the other hand, is used for integer-location based indexing. This allows you to select rows by their integer position in the DataFrame, such as df.iloc[2] to select the third row (remembering that indexing starts at 0).
| # Import pandas package import pandas as pd # Define a dictionary containing employee data data = {'Name':['Mike', 'Bob', 'Kate', 'Josh'], 'Age':[27, 24, 22, 32], 'Address':['NY', 'GA', 'AZ', 'KY'], 'Qualification':['Msc', 'MA', 'MBA', 'Phd']} # Convert the dictionary into DataFrame df = pd.DataFrame(data) # select two columns print(df[['Name', 'Qualification']]) |
Output:

Working with Missing Data
Missing data arises when information is unavailable for certain entries in a dataset. This can occur at the item level (specific data points missing) or the unit level (entire rows or columns missing). Handling missing data effectively is crucial, as it can significantly impact the accuracy of analysis and modeling. In Pandas, missing data is typically represented as NaN (Not a Number) or NA (Not Available).
Checking for Missing Values
Pandas provides two essential functions to identify missing data:
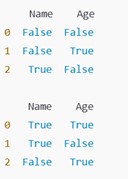
- isnull(): This function returns a DataFrame or Series of the same shape, with True for missing (NaN) values and False otherwise.
- notnull(): This function does the opposite, returning True for non-missing values and False for missing ones.
These functions can be applied to both Pandas DataFrames and Series to locate missing values. For example:
| import pandas as pd import numpy as np # Sample DataFrame with missing values data = {'Name': ['Alice', 'Bob', np.nan], 'Age': [25, np.nan, 30]} df = pd.DataFrame(data) # Check for missing values print(df.isnull()) # Check for non-missing values print(df.notnull()) |
Output:
Reading CSV Files with Pandas
CSV (Comma-Separated Values) files are a common format for storing large datasets in plain text, making them easily accessible and compatible with various tools, including Pandas.
Reading a CSV File into a DataFrame
You can load a CSV file into a Pandas DataFrame using the read_csv() method.
Example: Loading a CSV File
Here’s an example using a file named data.csv:
| import pandas as pd # Load the CSV file into a DataFrame df = pd.read_csv('data.csv') # Display the entire DataFrame print(df.to_string()) |
The to_string() method is used to print the entire DataFrame, which can be especially useful for inspecting smaller datasets.
Notes:
- Ensure the CSV file is in the same directory as your script, or provide the full file path.
- Pandas automatically interprets the file format and reads the data efficiently.